Polybacktest
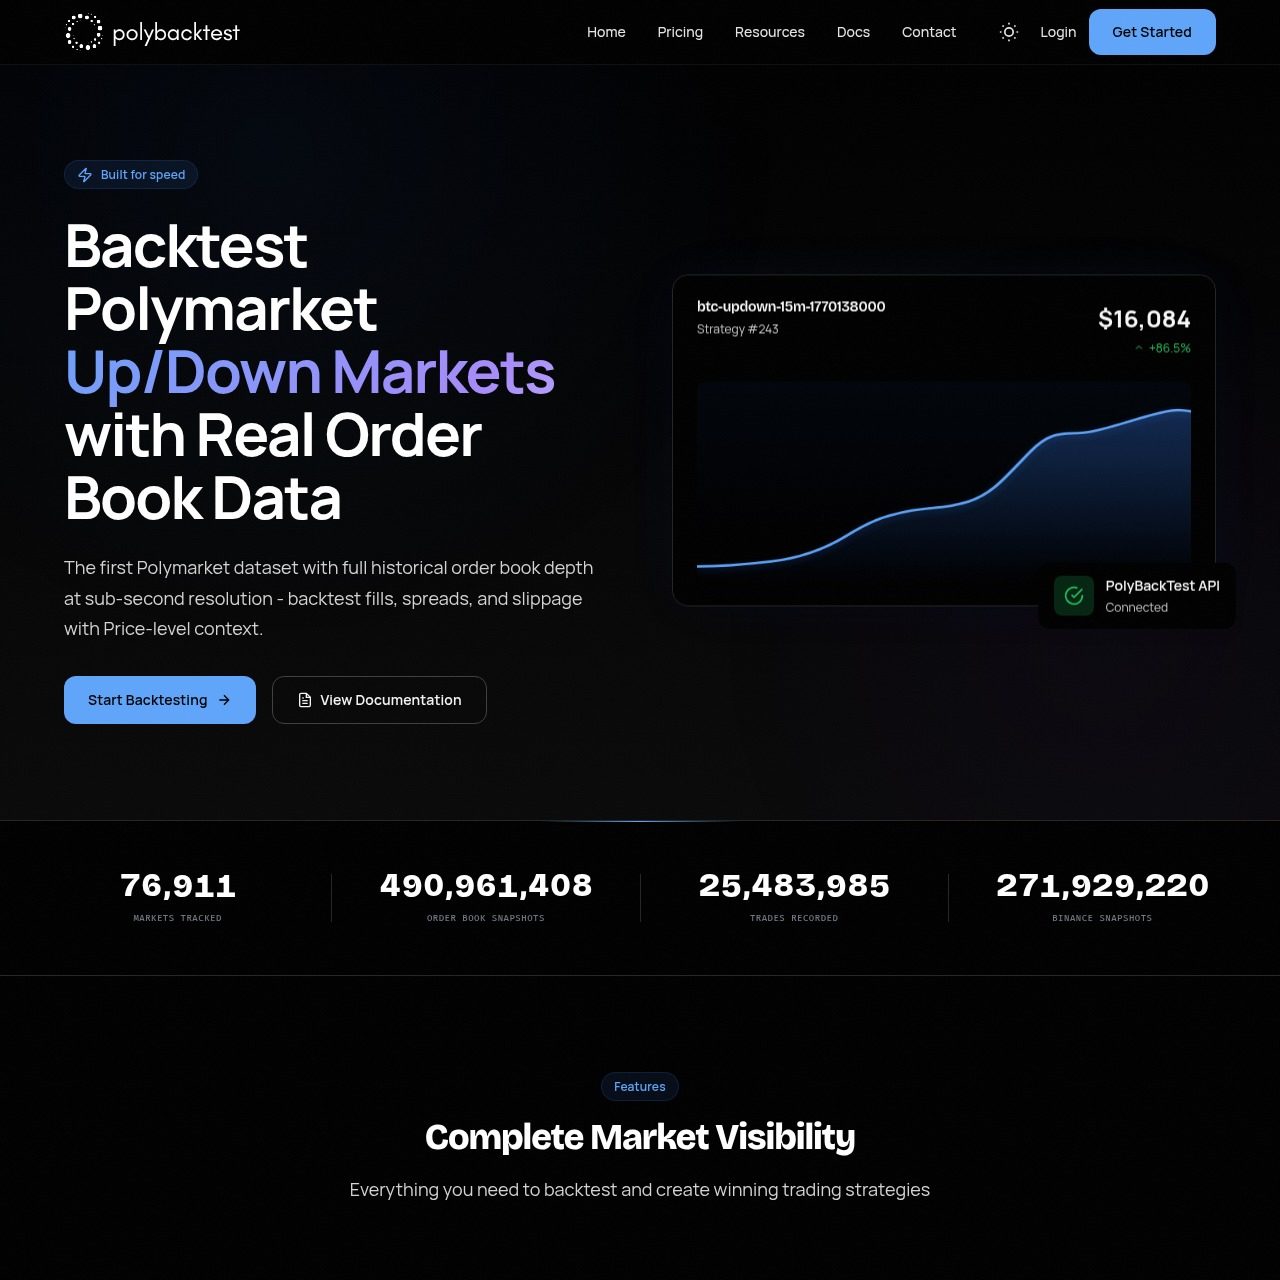
Polybacktest provides granular historical order book data to help traders simulate strategy performance on Polymarket with high precision.
Polybacktest API for Polymarket Order Book Backtesting and Data
What is Polybacktest?
Polybacktest provides high precision historical order book data and a REST API for traders to backtest strategies on Polymarket bitcoin and ethereum markets.
Ready to try Polybacktest?
Open the official site and get started in a few clicks.
Polybacktest Overview
Traders use Polybacktest to run strategy simulations on Polymarket prediction markets. Users get full order book depth snapshots at sub-second intervals. The dataset contains bitcoin and ethereum up down token pairs. Users query historical moments or pull real-time data through a REST API or a Python SDK. They receive detailed bid and ask levels alongside aligned external price references.
Quantitative traders and bot developers use this API to test crypto event contracts. They validate their ideas before they commit real capital. This process helps them avoid losses from slippage and wide spreads. Researchers also use these detailed snapshots to study price discovery. Traders who build automated systems use the tool to test strategies frequently.
Most standard data feeds do not have the detail needed for realistic backtesting. Polybacktest archives complete order book states to solve this problem. The service keeps this data even after markets resolve. Traders replay exact market conditions to see how their orders execute with real liquidity. They get bitcoin and ethereum reference prices from sources that match Polymarket settlement rules. This alignment makes simulations accurate.
Jack Carroll launched Polybacktest in February 2026. It is an independent project with no official ties to Polymarket. The service is a research tool and processes payments through Stripe. Users can start with a free tier to test the API responses before they upgrade to a paid subscription.
Polybacktest Key features
-
Sub-second order book depth
The service saves the full stack of bids and asks for up and down tokens at sub-second intervals. Traders use this data to calculate exact fill prices.
-
Historical data preservation
The database stores complete order book snapshots long after markets resolve. Traders replay past market conditions to test their strategies.
-
Aligned reference prices
The platform includes Bitcoin and Ethereum prices that match Polymarket settlement rules. Traders analyze how external price movements affect prediction token prices.
-
Python SDK support
Developers use a ready-made Python library to fetch market metadata. This tool helps programmers focus on strategy logic.
Polybacktest Demo video
Polybacktest Screenshots
Polybacktest User Reviews
-
The sub-second order book depth lets me simulate how my size moves the market on BTC contracts. I stopped guessing on slippage and burning capital. Now I iterate strategies in hours. The historical coverage on resolved markets provides the statistical validation I need. I recommend this to anyone building an edge.
View on X ↗ -
The API response times are fast. Having full bid and ask stacks aligned with reference prices makes backtesting feel realistic. I caught several strategies that looked profitable on charts but failed on actual liquidity. This saved me from deploying bots that would have lost money.
View on X ↗ -
Polybacktest provides sub-second historical data. It turned my vague ideas into numbers with real fill modeling. Anyone running bots on these up or down markets needs this level of granularity. It removes the guesswork around stale prices and liquidity impact.
View on X ↗
Is Polybacktest safe & legit?
Australian developer Jack Carroll created Polybacktest in February 2026. Active Polymarket traders trust the tool to test their strategies. The site has low traffic and a private domain registration, but users have reported no scams or security risks.
X account intel @polybacktest
-
Based in Australia
-
Joined X August 2025 10 months ago
-
Username changes 2 renames last on Feb 2, 2026
-
Signup source Australia App Store
Public profile signals from X. Use as one input alongside other due-diligence.
Wallet blacklist scan checked Jul 2, 2026
- MetaMask Not flagged
- Phantom Not flagged
- ScamSniffer Not flagged
- EtherAddressLookup Not flagged
- Keplr Wallet Not flagged
Domain polybacktest.com checked against public crypto wallet blacklists.
Polybacktest Updates
-
 ROBERT KIYOSAKI: “Even 0.01 of a Bitcoin is going to be priceless in two years."
- 8 replies
- 2 reposts
- 29 likes
- 2.2K views
-
Tom Lee said, "I think Bitcoin hits $180,000 by June."
It's already July now.
- 5 replies
- 1 reposts
- 28 likes
- 2.1K views
-
Michael Saylor gave his updated Bitcoin price predictions:
• $150,000 by end of this year
• $1,000,000 over next 4-8 years
• $20,000,000 over next 20 years- 10 replies
- 4 reposts
- 34 likes
- 5.8K views
-
Strategy CEO Phong Le said they have 72 years of Bitcoin reserves to last until 2100
"We're creating a bulletproof balance sheet for the next 65-100 years."- 3 replies
- 2 reposts
- 19 likes
- 2.3K views
-
🇺🇸 SCOTT BESSENT: "If you're on public assistance, you can no longer wire money out of the country!"

- 15 likes
- 1.4K views
-
“If I put $100 in Bitcoin in 2010 I’d have $2.8B now.”
No.
If you bought $100 of Bitcoin in 2010 and watched it go to:
$1k → $100k → $1.7M
and did nothing
Then watched $1.7M go to $170k
and still did nothing
Then watched $170k go to $110M
and still did nothing
Then watched $110M wither to $18M
and still did nothing
Then watched $18M surge to $390M
and still did nothing
Then watched $390M deteriorate to $85M
Then watched $85M climb to $1.6B
and still did nothing
Then watched $1.6B shrink to $390M
and still did nothing
Then watched $390M surge to $2.8B
and then for some reason finally decided to do something…
Then yes, $100 in 2010 would be worth $2.8B today.- 5 replies
- 2 reposts
- 35 likes
- 3.9K views
-
The 4-minute leader is not the edge. The flow behind it is.
We tested 2,833 BTC, ETH, and SOL 5-minute events on Polymarket.
The question:
With 60 seconds left, should you trust the side currently leading?
Only when Binance taker flow is pushing the same way.
The setup:
Watch a 5-minute crypto market.
Wait until 4 minutes after open.
Require the underlying coin to have moved at least 0.5 basis points from the market start.
Check Binance spot taker flow from market open to that checkpoint.
If price and taker flow point the same way, follow the leader.
If price and taker flow point opposite ways, do not chase the leader.
The raw 4-minute leader was decent, but not enough by itself:
Across all 2,833 events, the side leading with 60 seconds left won 57.6% of the time.
That sounds useful until you remember the leader is usually already expensive.
But the split was sharp:
When price direction and Binance taker flow agreed, the leader won 70.2% of the time across 1,592 events.
When price direction and taker flow diverged, the leader won only 41.3% across 1,241 events.
So the same early price lead had two completely different meanings.
Flow agreement meant the move had pressure behind it: market buys were lifting price, or market sells were pushing it lower.
Flow divergence meant aggressive traders were hitting one side, but price was not following them.
That is usually absorption, not confirmation.
The trading filter is simple:
Follow the 4-minute leader when taker flow agrees.
Stop paying up for the 4-minute leader when taker flow diverges.
If you do turn divergence into a fade, the full follow-or-fade rule won 65.2% overall across the 2,833 events.
This was not just one coin carrying the sample:
BTC: alignment leader won 70.3%; divergence leader won 37.7%.
ETH: alignment leader won 71.5%; divergence leader won 37.1%.
SOL: alignment leader won 68.9%; divergence leader won 49.9%.
We also split the events chronologically.
The follow-or-fade rule won 66.0% in the first half and 64.3% in the second half.
The trader read:
Do not buy the early leader just because the chart moved.
Buy it when the move has net aggressive flow behind it.
Be skeptical when aggressive flow is pushing the other way and price refuses to follow.
The price discipline is the whole game.
For aligned leaders, the measured hit rate was 70.2%, so a 72c ask is already too expensive before spread.
For the full follow-or-fade rule, the measured hit rate was 65.2%, so the entry has to clear that bar.
The signal is not "buy the leader late."
The signal is "buy the leader only when price and aggressive flow agree, and only when the ask leaves room."
The next test is obvious: stream the 240-second leader, Binance taker-flow imbalance, and live token ask together, then only enter when the ask leaves room.
Build that flow-alignment map at @polybacktest.- 4 replies
- 17 likes
- 1.1K views
-
The best BTC underdog setup was not the quiet market. It was controlled chop.
We scanned 84,327 BTC 5-minute potential trades from dense Polymarket snapshots.
The rule:
1. Watch a BTC 5-minute market.
2. Check every 15 seconds from 0:45 to 4:30.
3. Find the loosing token.
4. Only enter if the loosing token is priced from 45c to 50c.
5. Require BTC's high-low range over the prior 60 seconds to be 3 to 8 basis points.
6. Buy the underdog and hold to resolution.
Across 3,009 trades in 1,599 markets, this won 49.2% of the time at an average entry of 47.0c.
Average result: 2.1c per share.
That may not sound huge until you compare it to the full 45-50c underdog baseline:
All 45-50c underdogs: 9,660 trades, 47.1% won, +0.1c per share.
Only after a 3-8 bp last-minute BTC range: 3,009 trades, 49.2% won, +2.1c per share.
The range filter mattered:
0-1 bp range: 1,958 trades, 46.4% won, -0.7c per share.
1-3 bp range: 3,842 trades, 46.1% won, -0.9c per share.
3-8 bp range: 3,009 trades, 49.2% won, +2.1c per share.
8+ bp range: 851 trades, 46.3% won, -0.7c per share.
The price discipline mattered too:
Inside the same 3-8 bp range:
35-45c underdogs won 39.6% and made +0.1c per share.
45-50c underdogs won 49.2% and made +2.1c per share.
50-55c underdogs won 51.8% and made +1.7c per share.
The read:
When BTC barely moves, the underdog is cheap for a reason. The favorite is not being tested.
When BTC rips too far, the underdog is often just catching a falling knife.
The useful zone was controlled chop: enough movement to keep both outcomes live, not enough movement to make the favorite structurally dominant.
The tradeoff is simple: you are buying near-even underdogs, so the edge depends on not chasing above 50c. At 45-50c, a roughly coin-flip outcome can still pay. Above that, the cushion gets thin fast.
The next test is execution: add top-of-book asks, minimum displayed size, and coin-specific range buckets.
Build that version on fresh markets at @polybacktest.- 2 replies
- 18 likes
- 1.4K views
Polybacktest Reviews & Comments
No reviews yet. Be the first to share your experience.
Polybacktest alternatives
Other Polymarket tools that do a similar job. Compare and pick what fits your workflow.
-
Compare
Predict Parity
Traders who want consolidated market data, trader leaderboards, and on-chain analytics ac…
-
Compare
Polyfactual
Polyfactual combines live prediction market data with AI to give traders and developers i…
-
Compare
Polymarket Analytics
Traders who want to copy top Polymarket wallets or spot fading opportunities use Polymark…
-
Compare
Polymarket CLI
Developers and AI agents get full terminal access to Polymarket markets, order books, tra…
Recommended reading
In-depth guides for Data & APIs — get more out of tools like Polybacktest.
-
Strategy
Polymarket Builders Program: How Developers Earn From Routed Trading Volume
A clear guide to the Polymarket Builders Program. Learn how builder codes, builder fees, and weekly USDC rewards pay developers f…
6 min read -
Tutorials
Polymarket XTracker API and Elon Musk Tweet Count Markets: A Practical Guide
Read the XTracker API, compare counts to live Polymarket odds, and learn what moves Elon Musk's tweet volume each week.
8 min read -
Beginners
Polymarket Weather Markets: A Data-First Trading Guide
Learn how to trade Polymarket weather markets with a repeatable workflow: read the station rules, stack ECMWF and METAR forecasts…
8 min read


Ready to try Polybacktest?
Open the official site and get started in a few clicks.
Leave a comment